CSIR NET Gene Mapping Notes PDF Download
Gene mapping is an important concept in genetics, and it plays a crucial role in understanding the structure, function, and evolution of genes. Gene mapping methods can be broadly classified into two categories: classical mapping methods and molecular mapping methods. In this article, we will discuss the classical mapping methods, including linkage maps, tetrad analysis, and mapping with molecular markers, as well as molecular mapping methods such as mapping by using somatic cell hybrids and development of mapping population in plants. We will also provide tips on how to study and revise these topics for the CSIR NET life science exam, and sample questions with answers to help you test your understanding of the concepts.
Linkage Maps
Linkage maps are an essential tool in genetic research, providing insight into the arrangement of genes on a chromosome and their relative distances from each other. Here are some detailed notes on the concept of linkage maps:
- Linkage maps are constructed by analyzing data from genetic crosses, where the frequency of recombination between two genes is used to estimate their distance apart on the chromosome.
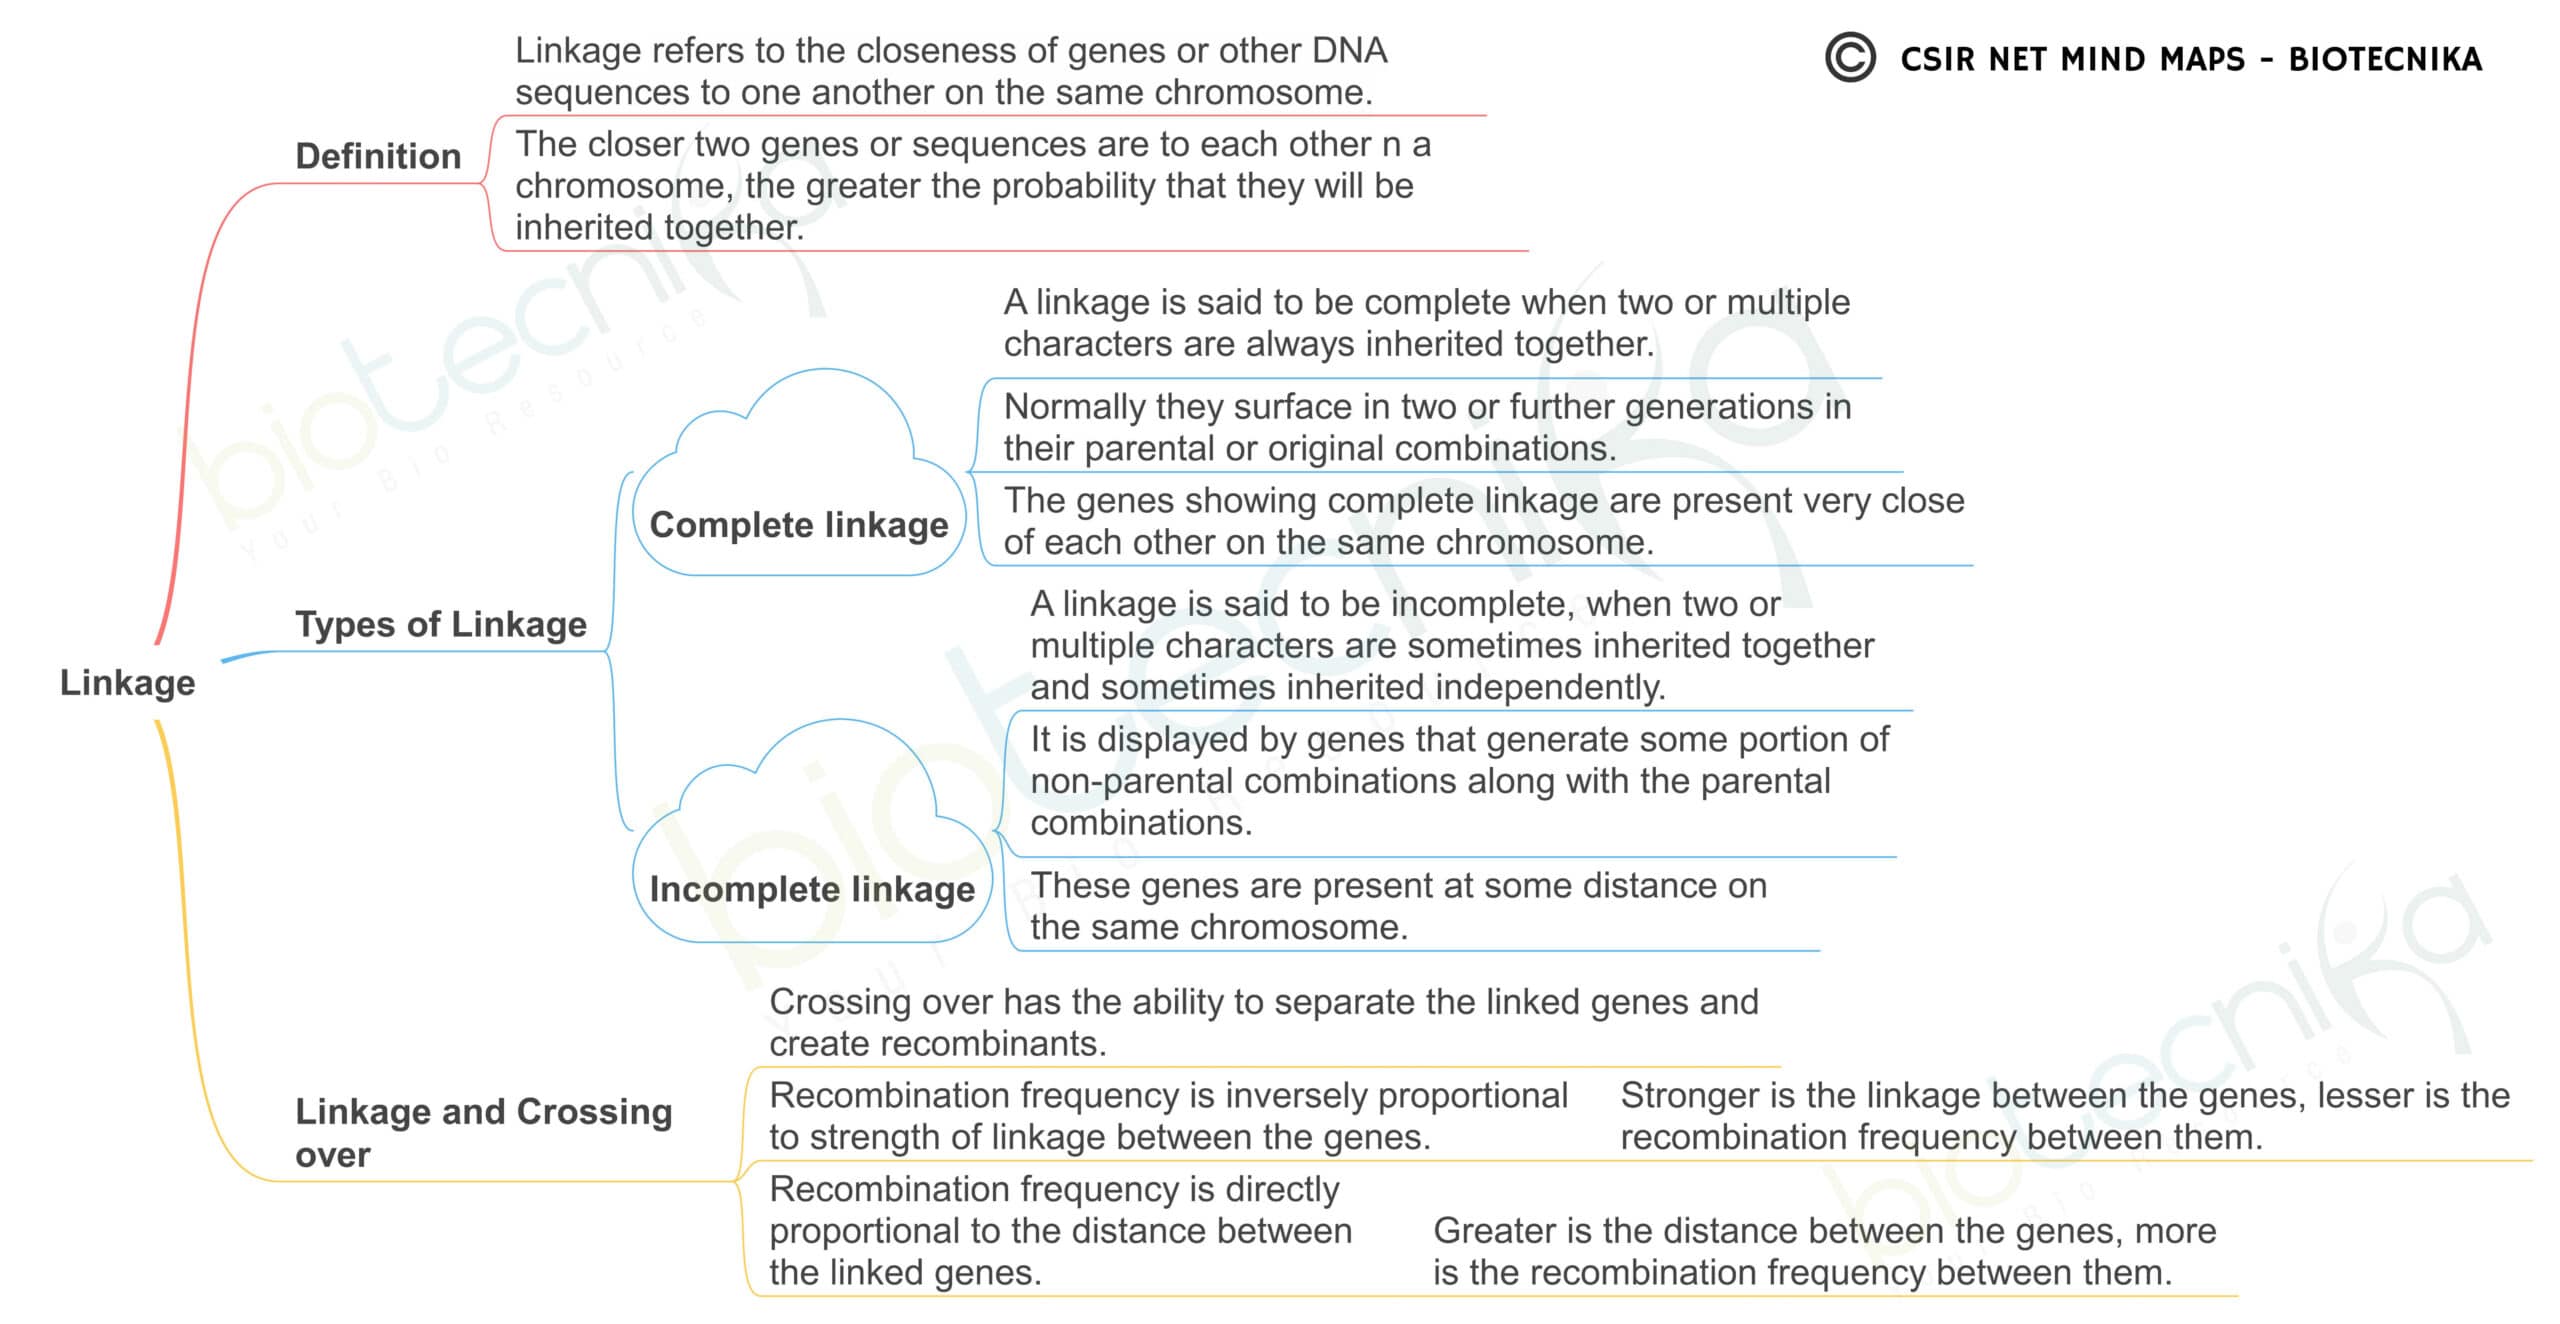
- Genetic linkage refers to the tendency of two or more genes located on the same chromosome to be inherited together more frequently than expected by chance.
- The frequency of recombination between two genes depends on the distance between them on the chromosome. Genes that are located close together have a lower probability of recombination, while genes that are farther apart have a higher probability of recombination.
- The unit of distance on a linkage map is the centimorgan (cM), which represents a 1% chance of recombination between two genes.
- The use of linkage maps has several applications in genetics, including identifying disease genes, mapping quantitative trait loci (QTLs) that control complex traits, and the study of genome evolution.
- Limitations of linkage maps include the fact that they only provide estimates of distance and are subject to error due to the occurrence of double crossovers and other factors.
Download FREE CSIR NET Gene Mapping Notes + Below Given Linkage Mind Map
To effectively study and prepare for the CSIR NET exam on linkage maps, here are some tips:
- Understand the basic principles of genetic linkage, including the definition and factors that affect the frequency of recombination.
- Learn how to calculate the map distance between two genes using the formula: map distance = (recombinant progeny/total progeny) x 100.
- Practice interpreting linkage maps to identify the relative order and distance between genes.
- Study the limitations of linkage maps and understand their applications in genetics research.
- Practice solving sample problems and questions to test your understanding of the concepts.
Sample question:
Q1. In a cross between two plants with the genotype AaBb, what proportion of the offspring is expected to be AaBb if the two genes are located on different chromosomes?
Answer: If the two genes are located on different chromosomes, they will assort independently, and the proportion of offspring that is AaBb will be 25%.
Q2. In a cross between a plant with purple flowers and a plant with white flowers, a linkage map was constructed with two genes, A and B. The distance between A and B was 20 cM. What is the likelihood of a double crossover between these two genes?
Answer: The likelihood of a double crossover is equal to the product of the recombination frequencies between A and B and between B and A, which is 0.2 x 0.2 = 0.04 or 4%.
CSIR NET Gene Mapping Notes PDF Download
Tetrad Analysis
Tetrad analysis is a genetic method used to study the segregation of genes during meiosis in fungi, such as yeast. In tetrad analysis, the four spores produced by a single meiosis are analyzed to determine the arrangement of the alleles on the chromosomes. This method allows the determination of the order and distance between genes on a chromosome, as well as the identification of double crossovers.
Download Tetrad Analysis FREE Notes + Mind Map Here
Here are some detailed notes on the concept of tetrad analysis:
- Tetrad analysis is used to study the segregation of genes during meiosis in fungi.
- Fungi produce spores in groups of four called tetrads, which can be analyzed to determine the arrangement of alleles on the chromosomes.
- In tetrad analysis, the arrangement of the alleles on the chromosomes can be classified into four types: parental ditype (PD), non-parental ditype (NPD), tetratype (T), and aberrant.
- The frequency of each type of tetrad can be used to determine the order and distance between genes on a chromosome.
- The unit of distance on a tetrad map is the centimorgan (cM), which represents a 1% chance of recombination between two genes.
- Limitations of tetrad analysis include the difficulty in analyzing large numbers of tetrads and the effects of gene conversion.
Gene Mapping Method Lecture
To effectively study and prepare for the CSIR NET exam on tetrad analysis, here are some tips:
- Understand the basic principles of tetrad analysis, including the structure of fungal tetrads and the different types of gene segregation patterns.
- Learn how to determine the order and distance between genes using the frequency of different types of tetrads.
- Practice interpreting tetrad maps to identify the relative order and distance between genes.
- Study the limitations of tetrad analysis and understand its applications in genetics research.
- Practice solving sample problems and questions to test your understanding of the concepts.
Sample question:
Q1. In a tetrad analysis of a cross between two strains of yeast, the following tetratype frequencies were observed: 34 PD, 16 NPD, and 10 T. What is the map distance between the two genes?
Answer: The map distance between the two genes can be calculated using the formula: map distance = (2 x T + NPD) / (2 x total tetrads) x 100. In this case, the map distance is (2 x 10 + 16) / (2 x 60) x 100 = 43.3 cM.
Q2. In a tetrad analysis of a cross between two strains of yeast, the following tetrad frequencies were observed: 25 PD, 10 NPD, 15 T, and 5 aberrant tetrads. What is the interference between the two genes?
Answer: Interference can be calculated using the formula: I = 1 – (observed double crossovers / expected double crossovers). The expected double crossovers can be calculated as the product of the two single crossover frequencies, while the observed double crossovers are the aberrant tetrads. In this case, the expected double crossovers are (1 – (0.25 + 0.1)) x (0.15 + 0.1) x 100 = 15.6%, and the observed double crossovers are 5. Therefore, the interference is 1 – (5 / 15.6) = 0.68 or 68%. This indicates that there is a strong negative interference between the two genes.
Mapping with Molecular Markers
Mapping with molecular markers is a genetic method used to determine the location of genes on a chromosome using DNA markers. DNA markers are short sequences of DNA that are polymorphic between individuals and can be used to track the inheritance of specific regions of the chromosome. The most commonly used DNA markers for mapping include restriction fragment length polymorphisms (RFLPs), amplified fragment length polymorphisms (AFLPs), and simple sequence repeats (SSRs).
CSIR NET Gene Mapping Notes PDF Download
Here are some detailed notes on the concept of mapping with molecular markers:
- Mapping with molecular markers involves the use of DNA markers to track the inheritance of specific regions of the chromosome.
- The most commonly used DNA markers for mapping include RFLPs, AFLPs, and SSRs.
RFLPs are DNA fragments that vary in size due to variations in the number and location of restriction enzyme recognition sites. They are detected using a hybridization probe that binds to the DNA fragment of interest. - AFLPs are DNA fragments that vary in size due to variations in the number and location of restriction enzyme recognition sites, as well as the PCR primers used to amplify the DNA. They are detected using gel electrophoresis.
- SSRs are short DNA sequences that are repeated in tandem and vary in length between individuals. They are detected using PCR amplification and gel electrophoresis.
Mapping with molecular markers allows for high resolution and accuracy in determining the location of genes on a chromosome. - The distance between two molecular markers on a chromosome is measured in terms of map units, which represent a 1% chance of recombination between the two markers.
Limitations of mapping with molecular markers include the high cost and time-consuming process of genotyping and the potential for errors due to mutations and incomplete linkage.
Download FREE CSIR NET Gene Mapping Notes
To effectively study and prepare for the CSIR NET exam on mapping with molecular markers, here are some tips:
- Understand the basic principles of molecular markers, including the different types of DNA markers and how they are analyzed.
- Learn how to interpret data from molecular markers, including the identification of polymorphic markers and the calculation of recombination frequencies.
- Understand the advantages and limitations of mapping with molecular markers, including the high resolution and accuracy, but also the high cost and time-consuming process of genotyping.
- Practice solving sample problems and questions to test your understanding of the concepts.
- Study the applications of mapping with molecular markers in genetics research, including the identification of disease genes and the mapping of quantitative trait loci (QTLs).
Download FREE Notes + Mind Map Here
Sample question:
Q1. In a mapping experiment using AFLP markers, two genes, A and B, were found to be linked with a recombination frequency of 8%. How far apart are these genes on the chromosome in cM?
Answer: The distance between the two genes can be calculated using the formula: distance = recombination frequency x 100. In this case, the distance between the two genes is 8 cM.
Q2. In a mapping experiment using RFLP markers, two genes, X and Y, were found to be linked with a recombination frequency of 12%. If a genetic marker located 4 cM away from gene X is used to select for a particular trait, what is the likelihood of selecting for the allele of gene Y that is linked to the favorable allele of gene X?
Answer: The likelihood of selecting for the allele of gene Y linked to the favorable allele of gene X can be calculated using the formula: likelihood of selection = (recombination frequency between X and Y / total map distance) x 100. In this case, the total map distance is 4 cM + (12/2) cM = 10 cM (since the recombination frequency is between X and Y, not X and the marker). Therefore, the likelihood of selection is (12/10) x 100 = 120%. This indicates that there is a high probability of selecting for the allele of gene Y linked to the favorable allele of gene X.
Note: A likelihood of selection greater than 100% indicates a phenomenon called “hitchhiking” or “genetic linkage disequilibrium,” which occurs when a favorable allele is linked to another gene that is being selected for, leading to an over-representation of the favorable allele in the population.
Mapping by Using Somatic Cell Hybrids
Mapping by using somatic cell hybrids is a genetic method used to map genes to specific human chromosomes. This method involves fusing human cells with cells from a different species, such as a mouse or hamster, to create a hybrid cell with two sets of chromosomes. The hybrid cells can be analyzed to determine which human chromosomes are present and to map the location of genes on those chromosomes.
Here are some detailed notes on the concept of mapping by using somatic cell hybrids:
- Mapping by using somatic cell hybrids involves fusing human cells with cells from a different species, such as a mouse or hamster, to create a hybrid cell with two sets of chromosomes.
- The hybrid cells can be analyzed to determine which human chromosomes are present and to map the location of genes on those chromosomes.
- The hybrid cells are selected for the presence of the human chromosome of interest, and the location of specific genes can be determined using DNA probes that bind to specific regions of the chromosome.
- Mapping by using somatic cell hybrids allows for the mapping of genes to specific human chromosomes and can be used to identify disease genes and chromosomal aberrations.
- Limitations of this method include the potential for chromosomal rearrangements and the fact that only large-scale chromosomal changes can be detected.
To effectively study and prepare for the CSIR NET exam on mapping by using somatic cell hybrids, here are some tips:
- Understand the basic principles of somatic cell hybrids, including the process of cell fusion and selection for specific human chromosomes.
- Learn how to interpret data from somatic cell hybrids, including the identification of specific human chromosomes and the mapping of genes to those chromosomes.
- Understand the advantages and limitations of mapping by using somatic cell hybrids, including the ability to map genes to specific chromosomes but the limitations in detecting small-scale chromosomal changes.
- Practice solving sample problems and questions to test your understanding of the concepts.
- Study the applications of mapping by using somatic cell hybrids in genetics research, including the identification of disease genes and chromosomal aberrations.
Sample question:
Q1. In a mapping experiment using somatic cell hybrids, a human gene of interest is found to be present on a hybrid cell line containing human chromosomes 2 and 6, but not 5 or 8. What is the likely location of the gene on the human chromosome?
Answer: The likely location of the gene on the human chromosome can be determined using data from additional hybrid cell lines that contain different combinations of human chromosomes. By comparing the presence or absence of the gene of interest to the presence or absence of other known genes on each chromosome, the likely location of the gene can be narrowed down. In this case, additional hybrid cell lines would need to be analyzed to determine the specific location of the gene on either human chromosome 2 or
6.
Q2. In a mapping experiment using somatic cell hybrids, a gene of interest was found to be present in hybrid cell line A, but absent in hybrid cell line B. What can you conclude about the location of this gene on the chromosome?
Answer: This gene is located on the chromosome in a region that is present in hybrid cell line A, but absent in hybrid cell line B.
Development of Mapping Population in Plants
Development of mapping population in plants is a genetic method used to identify the location of genes on a plant chromosome. This method involves creating a population of plants with different combinations of genes and analyzing the inheritance patterns to determine the location of the genes of interest. The most commonly used mapping populations in plants are recombinant inbred lines (RILs), backcross populations, and F2 populations.
Download FREE CSIR NET Gene Mapping Notes
Here are some detailed notes on the concept of the development of mapping population in plants:
- Development of mapping population in plants involves creating a population of plants with different combinations of genes and analyzing the inheritance patterns to determine the location of the genes of interest.
- The most commonly used mapping populations in plants are recombinant inbred lines (RILs), backcross populations, and F2 populations.
- RILs are created by self-pollinating plants for several generations to produce genetically stable lines with different combinations of genes. They are ideal for mapping quantitative trait loci (QTLs).
- Backcross populations are created by crossing a plant with one desirable trait (the recurrent parent) with a plant that has a different desirable trait (the donor parent), and then repeatedly crossing the resulting hybrids back to the recurrent parent. They are ideal for mapping single dominant genes.
- F2 populations are created by crossing two genetically different plants and allowing them to self-fertilize to produce a population of plants with different combinations of genes. They are ideal for mapping single recessive genes.
- The distance between two genes on a chromosome is measured in terms of map units, which represent a 1% chance of recombination between the two genes.
- Limitations of mapping population development in plants include the time-consuming process of generating the populations and the difficulty in analyzing large numbers of plants.
To effectively study and prepare for the CSIR NET exam on the development of mapping population in plants, here are some tips:
- Understand the basic principles of mapping population development in plants, including the different types of mapping populations and their uses.
- Learn how to interpret data from mapping populations, including the identification of genetic markers and the calculation of recombination frequencies.
- Understand the advantages and limitations of mapping population development in plants, including the ability to map different types of genes and the time-consuming process of generating the populations.
- Practice solving sample problems and questions to test your understanding of the concepts.
- Study the applications of mapping population development in plants in genetics research, including the identification of disease genes and the mapping of QTLs.
Download FREE UNIT 8 Notes + Linkage Mind Map
Sample question:
Q1. In a mapping experiment using an RIL population, two genes, A and B, are found to be linked with a recombination frequency of 10%. How far apart are these genes on the chromosome in cM?
Answer: The distance between the two genes can be calculated using the formula: distance = recombination frequency x 100. In this case, the distance between the two genes is 10 cM.
Q2. In a mapping experiment using a mapping population of maize, two genes, A and B, were found to be linked with a recombination frequency of 10%. What is the likelihood of a double crossover between these two genes in this mapping population?
Answer: The likelihood of a double crossover can be calculated using the formula: likelihood of double crossover = (1/2) x (recombination frequency)^2. In this case, the likelihood of a double crossover is (1/2) x (0.1)^2 = 0.005 or 0.5%.
Tips for studying and revising for the CSIR NET life science exam: CSIR NET Gene Mapping Notes
- Focus on the key concepts and principles of each method, including the strengths and limitations of each method.
- Practice interpreting data from genetic crosses, pedigrees, and molecular markers, and calculating recombination frequencies and map distances.
- Use visual aids such as diagrams, charts, and tables to help you understand the relationships between genes and chromosomes.
- Work through sample questions and problems to test your understanding of the concepts, and identify areas where you need further practice.
- Use textbooks, online resources, and study guides to deepen your understanding of the topics, and consult with your peers and instructors for additional support.
In conclusion, gene mapping methods are important tools for understanding the structure, function, and evolution of genes and are often tested in life science exams such as the CSIR NET. By focusing on the key concepts and principles of linkage maps, tetrad analysis, mapping with molecular markers, mapping by using somatic cell hybrids, and development of mapping population in plants, and practicing with sample questions and problems, you can prepare effectively for the exam and enhance your understanding of the field of genetics.
Download FREE CSIR NET Gene Mapping Notes