CSIR NET Cutoff Analysis
The results for the first Computer Based CSIR NET examination were released on the official website on 30th January 2020. NTA had published 2 individual scores on the student’s marks card – the aggregate percentile with raw marks and the NTA score. The NTA score calculates the performance of the student as compared to the others competing in the examination and has helped in identifying the rank list. The aggregate percentile was used to declare the list of qualifiers in both the categories of JRF and LS.
Based on the average performance of the students and the number of fellowships available for the first half of the year, the cutoff was decided. As the CSIR NET exam was held online, the results were computed faster compared to the other years and the students have benefitted by receiving more time to plan their future goals. Earlier the publication of the results would take an average of 3-4 months and would be close to the registration for the next examination.
CSIR NET Cutoff Analysis – The cut off this year has led to a lot of discussions. While there has been an addition of a new category for
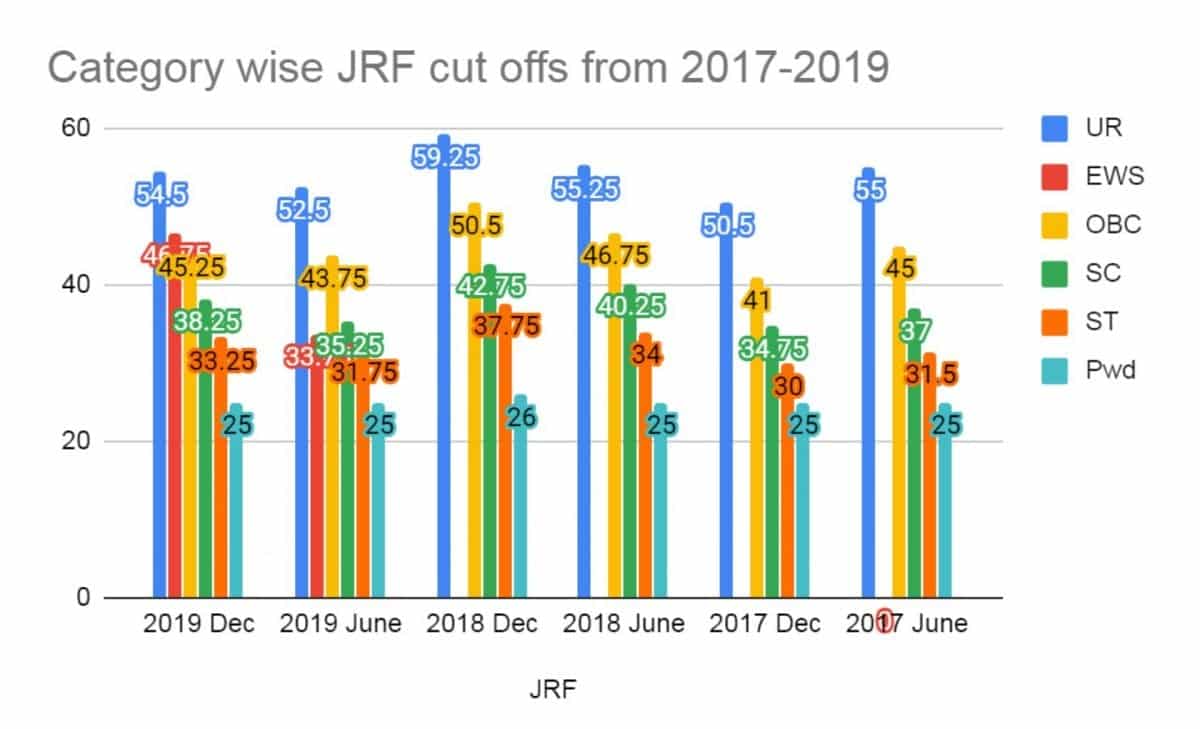
qualifiers (economically weak section), there also has been a comparative increase in the cutoff for JRF, since the past examination. A comparison has been made over the past 2 years and can be seen below.CSIR NET Cutoff Analysis – JRF
- The 2019 December CSIR JRF cut off is higher than that of 2019 June CSIR JRF, but when compared with 2018 December CSIR JRF, this year’s cut off has reduced considerably for all the categories.
- There has been an addition of a new category this year for the economically weaker section.
- The cut off has remained almost the same for the Pwd category during these years.
- The cut off for general category was always greater than 50% but has not yet crossed 60%.
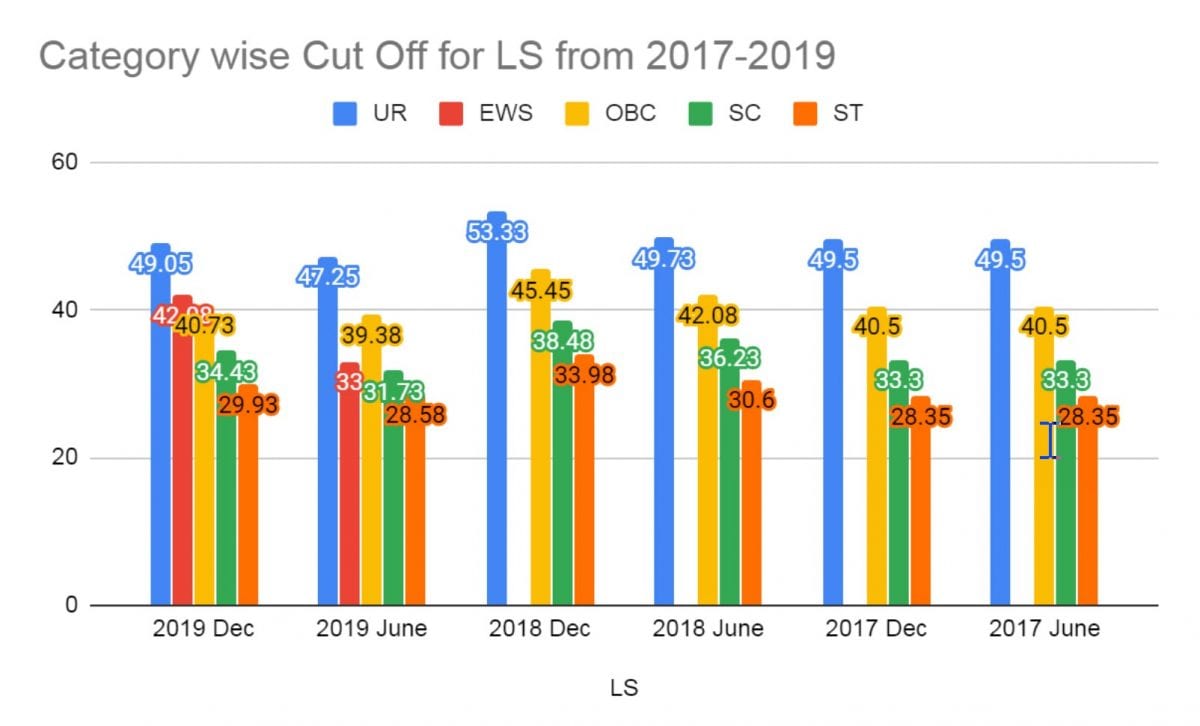
CSIR NET Cutoff Analysis – JRF
- The cut off for LS was highest in 2018 December. Rest all the years the cut off was almost the same around 49%.
CSIR NET Cutoff Analysis – While it is seen that JRF has shown quite a variation, the cutoff for LS seems to be quite consistent. Among the past two years, the Dec 2018 examination had the highest cutoff considered. There are many factors that lead to this variation.
Below is a list of the number of fellowships awarded across years under the three categories (additional clauses not considered). Comparing them will let us know how the cutoff is calculated. Every year, the government has an approved sum of funding which is allotted to the funding bodies CSIR and UGC. Based on the overall performance, difficulty level and the number of fellowships to be awarded, the cutoff is decided.
| YEAR/CATEGORY | JRF(I) | JRF (II) | TOTAL JRF AWARDED | LS |
| JUNE 2017 | 1858 | 1500 | 3358 | 3597 |
| DEC 2017 | 3973 | 1500 | 5473 | 4858 |
| JUNE 2018 | 1991 | 1500 | 3491 | 3756 |
| DEC 2018 | 1969 | 1500 | 3469 | 3989 |
| JUNE 2019 | 2150 | 1638 | 3788 | 3690 |
| DEC 2019 | 2185 | 1656 | 3841 | 4195 |
It is evident that Dec 2017 had witnessed the maximum number of fellowship grants and hence the number of qualified candidates was equally high. If you compare this data with the cutoff, that session exhibits the least cutoff.
Then again, there are various other factors to be considered.
- Has the level of difficulty changed?
- Has the pattern of the paper changed?
- How has the average student performance changed?
- Has the change from paper-based examination to computer-based test, changed the average performance?
The difficulty level of question paper:
Well, our student reviews have shed light on these facts. According to the students, CSIR NET Dec 2018 had seen quite an easy paper, compared to CSIR NET June 2018. That could be one of the reasons, the cutoffs for that session had gone up. Since the paper was comparatively easy, the highest score would automatically go up, and so would the overall performance. So, when the ranks are decided from the top level, there are comparatively number of qualifiers. So the cutoff automatically is increased to balance the qualifiers and the funding provided. As the years are progressing the questions are found to become more analytical and conceptual. However, the practice of past year papers does allow some benefits.
Paper Pattern:
Let us deliberate on the CSIR NET question paper pattern. The paper pattern and marks distribution remain the same throughout the examination, though the individual weightage of units continues to vary. If we look into the weightage of units, all units have an average of 7-9 marks allotted, under which the subunits distributions vary. A few subunits have seen more importance across the years, while a couple has been shown neglect. This has allowed the student to devise their examination preparation strategy.
CBT Mode vs Paper-pen:
Now, let us consider student performance during the CSIR NET CBT mode. In the paper-based mode, if a student would make a mistake in marking the OMR, it could not be rectified. However, the online examination allows the candidate to revisit their answered questions and change their answers. It also allows the candidate to visualize each question and jump back to question numbers he wishes to revisit. All in all, it has increased the average performance more than the last year, which could be an answer to why the cutoff has been increased slightly.
CSIR NET Cutoff Analysis – FUTURE CUT OFF PREDICTION AND STRATEGY
Though this performance and analysis do not limit the future of any candidate, it definitely has been involved in deciding the cutoff across the years. Based on all these facts the prediction for the coming session can be made. We have seen that the LS continues to be at a consistent score of 49 pointers and JRF varies due to the above-mentioned reasons. Again, it can be seen that the overall cutoff for the general category has not yet crossed 60 percentile in any of the past examinations, and has seen a steady average of 55 pointers. It can thus be predicted that LS will continue to battle around 50 percentile and JRF will continue to be at around 55 percentile.
Though the CSIR NET CBT mode has changed the average performance of students, the questions continue to increase in difficulty and the competition for gaining a stable strong career continues to be stronger than ever. It is vital to plan ahead and prepare with a unique strategy, that can allow one to qualify irrespective of the slight changes in the cutoffs. This means that a student would require to target a minimum of 140 marks on an average to be able to secure a certificate, after a few negative markings.
As the saying goes “By failing to prepare, you are preparing to fail”.
Conclusion – CSIR NET Cutoff Analysis
As an Intelligent student, you must use the data analysis above to your advantage, understand the nuances, read in between the lines and make yourself accustomed to the cut off demands and not just rely on your own preparation but also compete against your classmates in your coaching and give Quest – Monthly Class Test of Biotecnika with utmost devotion. You are also advised to practice using the AIMNET Test series on the NTA platform ( provided by BioTecNika to all its Coaching students). This exam should serve as a reminder to those who take CSIR NET lightly, this exam demands utmost devotion and dedication and you must take the guidance of best mentors available.
CSIR NET Cutoff Analysis – Data Analysis Courtesy: Data Analytics Team of BioTecNika, Article compiled by Senior BioTecNika Expert Ms Rashmi Sanyaal, edited by the head of editorial Team Ms Preety.


I have one query.
My percentile was 97.92 in Gen Category, which means only 2.08 percent of students have scored more than me i.e., near about 1728 candidates.
But the number of LS and JRF awarded are more than these number and I haven’t any.
What can be the reason?
That’s because it’s the total number of fellowships for ALL the subjects.
It also includes the fellowships of other subjects not for the life sciences only
I have one query.
My percentile was 97.92 in Gen Category, which means only 2.08 percent of students have scored more than me i.e., near about 1728 candidates.
But the number of LS and JRF awarded are more than these number and I haven’t qualified any of two.
What can be the reason?
what the use of NTA score? Result was declared on the basis of total marks obtained…
please clear me.
Actually i want to ask whether NTA score nd total score is same nd the NTA score is the percentage through which one get their name in fellowship.