


Ramachandran Plot Notes For CSIR
Ramachandran plot
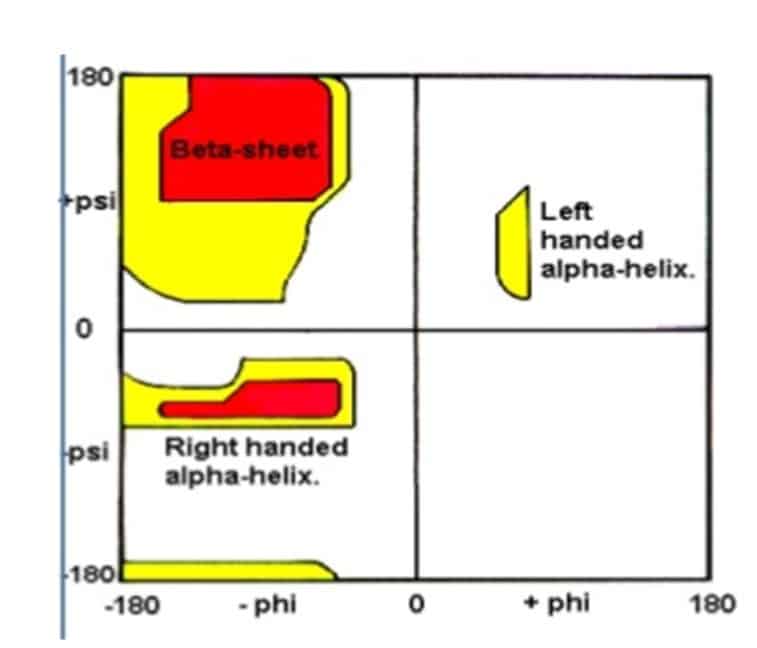
A Ramachandran plot (also known as a Ramachandran diagram or a [phi, psi ]plot, originally developed in 1963 by G.N. Ramachandran. White regions mean sterically disallowed for all amino acids except glycine. Red regions mean allowed regions namely the alpha-helical and beta-sheet conformations.
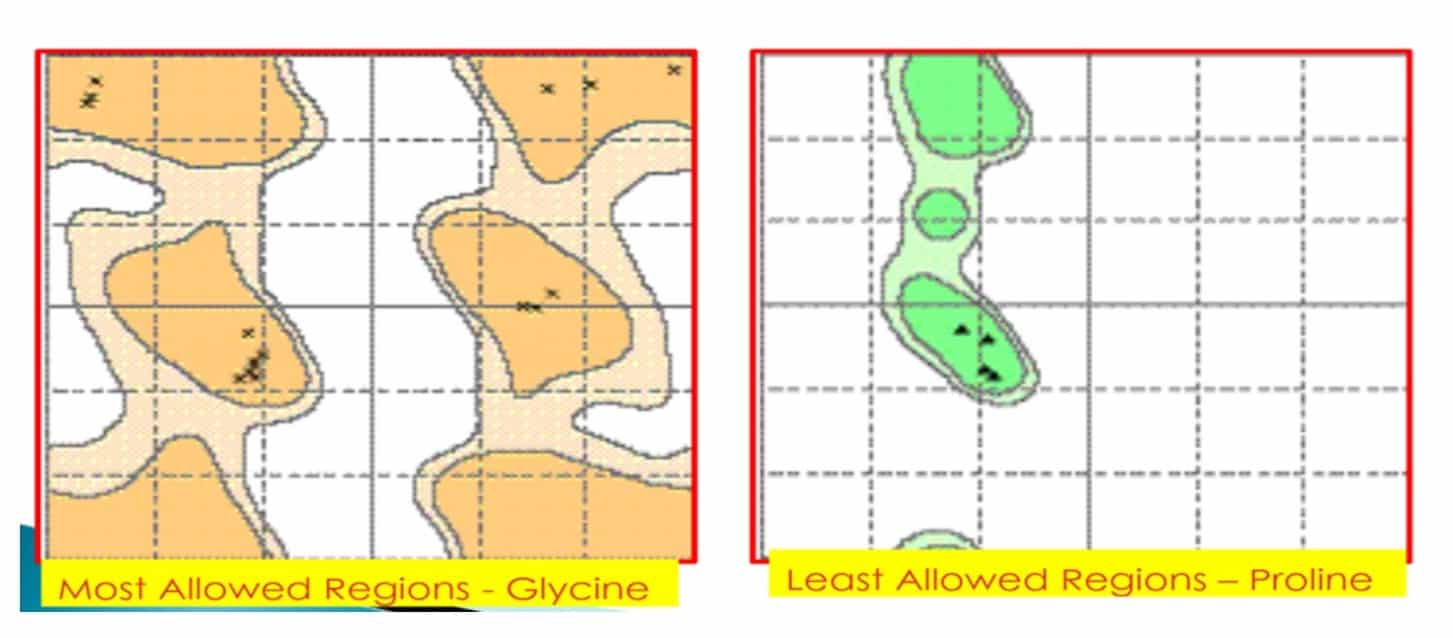
Yellow areas mean the outer limits. Pro limits F to -60° and Gly allows more freedom.
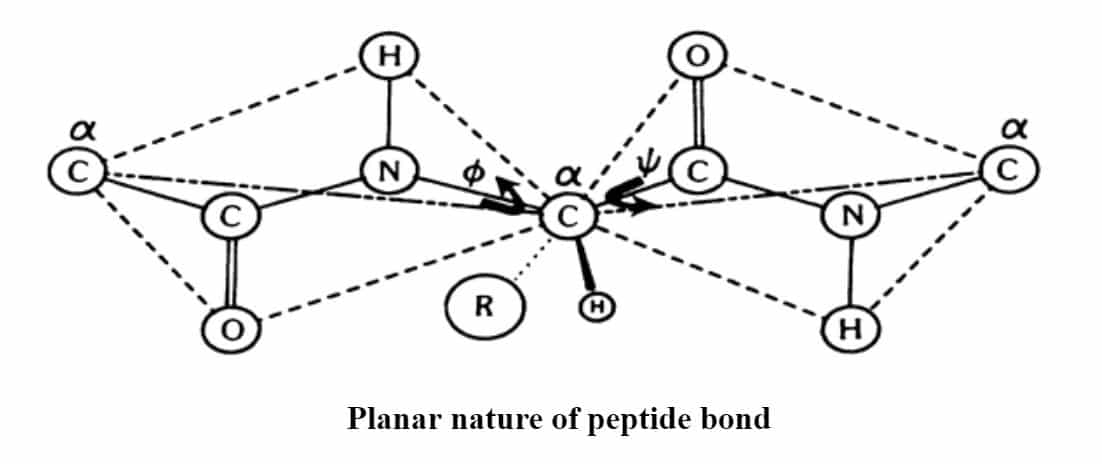
A polypeptide chain consists of a series of amino acids chemically linked by peptide bonds. The peptide bond can be considered a planar structure. Although usually the planarity can be construed as being imposed by the partial double-bond character of the amide group resulting from resonance stabilization. Given this planarity, it is evident that the conformation of a peptide can be described by two angles, the f angle and the y angle, which are those describing the rotations of two planar peptide bonds on either side of an a-carbon atom in the polypeptide. To describe the backbone conformation of a polypeptide chain, all one needs is a description of the y and f angles for each successive a-carbon atom in the chain. Because of steric considerations, certain of these angles are not possible: and ψ is interdependent. This holds only for those angles about a particular a-carbon atom. The ɸ and ψ angles of a given a-carbon are not affected by those angles of other alpha carbon atoms within the peptide.
The steric effects on f and y angles are conveniently represented in a Ramachandran plot, which shows energy contours in a plot of ɸ versus ψ shows such plots for glycine or alanine in a peptide. The plot for glycine is essentially symmetrical, whereas alanine, due to unfavorable side-chain contacts, has some additional areas of conformational space restricted. Onto diagrams such as these, energy contours can be superimposed that indicate within the sterically allowable areas which ones are energetically favored. Three types of interactions must be considered in assessing the energy of a particular conformation.
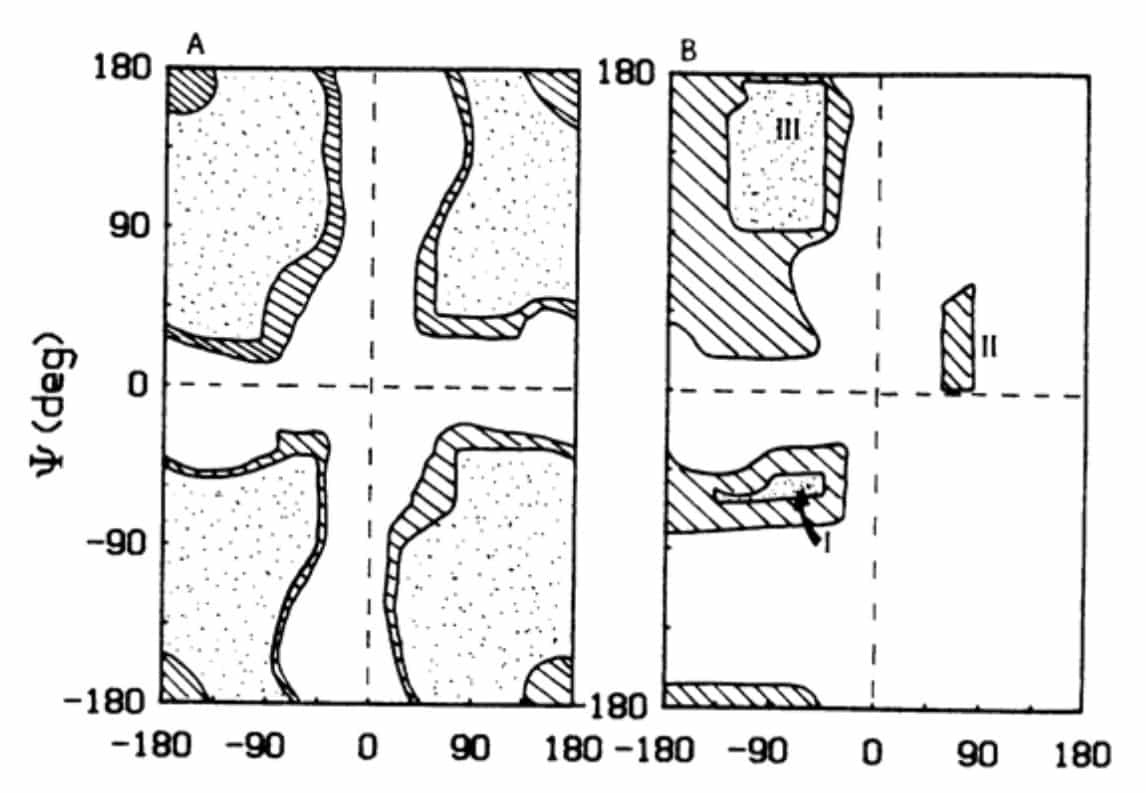
Ramachandran plots can be constructed for polymers of each of the 20 amino acids. It is significant to note that the Ramachandran plots for many amino acid residues are generally very similar, having only three regions with favorable or tolerated conformations. Differences do occur, however, because of its side chain a single hydrogen atom is small, and a Gly residue can take part in many conformations that are sterically forbidden for other amino acids. Glycine has no side chain and therefore can adopt ψ and φ angles in all four quadrants of the Ramachandran plot. Hence it frequently occurs in turn regions of proteins where any other residue would be sterically hindered.
How To Make Unit Wise Notes For CSIR NET Life Science Exam
| Secondary Structure | Φ | Ψ |
| Antiparallel βstrands | -139 | +135 |
| Parallel β strands | -119 | + 113 |
| R .H α-helix 3.6 | -57 | -47 |
| a-helix 310 | -49 | -26 |
| Left-handed helix | +57 | +47 |
| π-helix | -57 | -70 |
| Collagen Triple helix | -51 | + 153 |
| β turn type I i + 1 | -60 | -30 |
| βturn type I i+ 2 | -90 | 0 |
| β turn type II i + 1 | -60 | + 120 |
| β turn type II i + 2 | +80 | 0 |
| Polyproline I | -83 | + 158 |
| Polyproline II | -78 | + 149 |
| Polyglycine II | -80 | + 120 |
Table: Torsion angles for different secondary structures in proteins
For Complete Notes & PDF Fill Up The Form:
Keyword: Ramachandran Plot Notes For CSIR NET Exam, Notes on Ramachandran Plot


 2026 Notification Released – Check Eligibility, Syllabus & Apply Online")


Understanding and brief notes of related organic,inorganic and physical topics sir